Data Options
Relational
SHOW RESULTS BASED ON
INTERACTION LEVEL
DATE OF CONTACT
Attributes
COLOR NODES BY
MAP BASE LAYER DATA
Filters
APPLIED FILTERS
Settings
CLICK NODE FOR
LABEL COLOR
LINE COLOR
Map Legend
Welcome to the PARTNER/COVID-19 Dashboard Tour
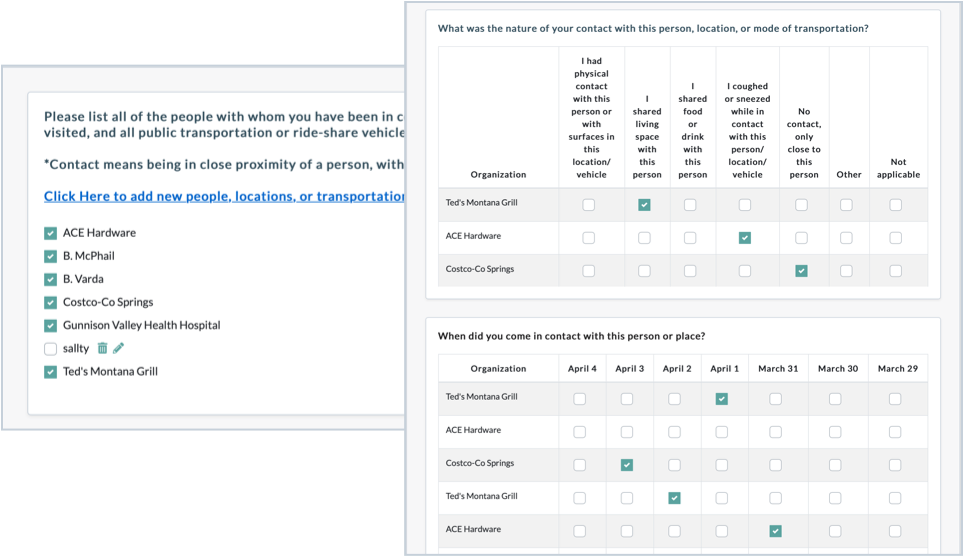
Where do the data come from?
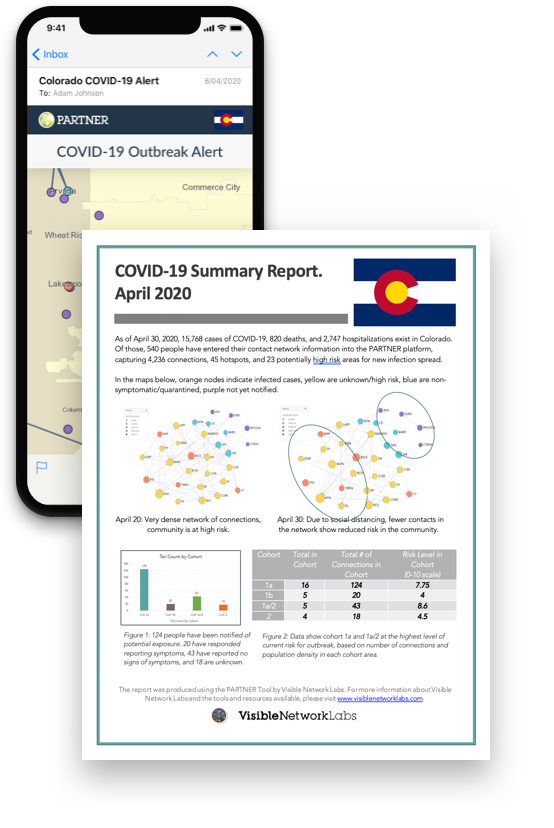
Notifications, Data Analysis, and Reporting


Notification features can be added to alert patients and locations of risk.
Data can be analyzed by date, patient information, population health statistics, and other critical measurements.
Reporting tools can quickly generate graphs and charts to show details fo the data, making it easy to summarize and communicate with public officials and policy makers.
{{ selectedNode.name }}
{{ selectedNode.city + ", " + selectedNode.state }}
BASIC INFORMATION
{{ getAttributeName(attribute.id) }}
{{ getAttributeOptionName(attribute.id, selectedNode.attributes[attribute.id]) }}
NETWORK SCORES
Degree Centrality
In-Degree Centrality
Out-Degree Centrality